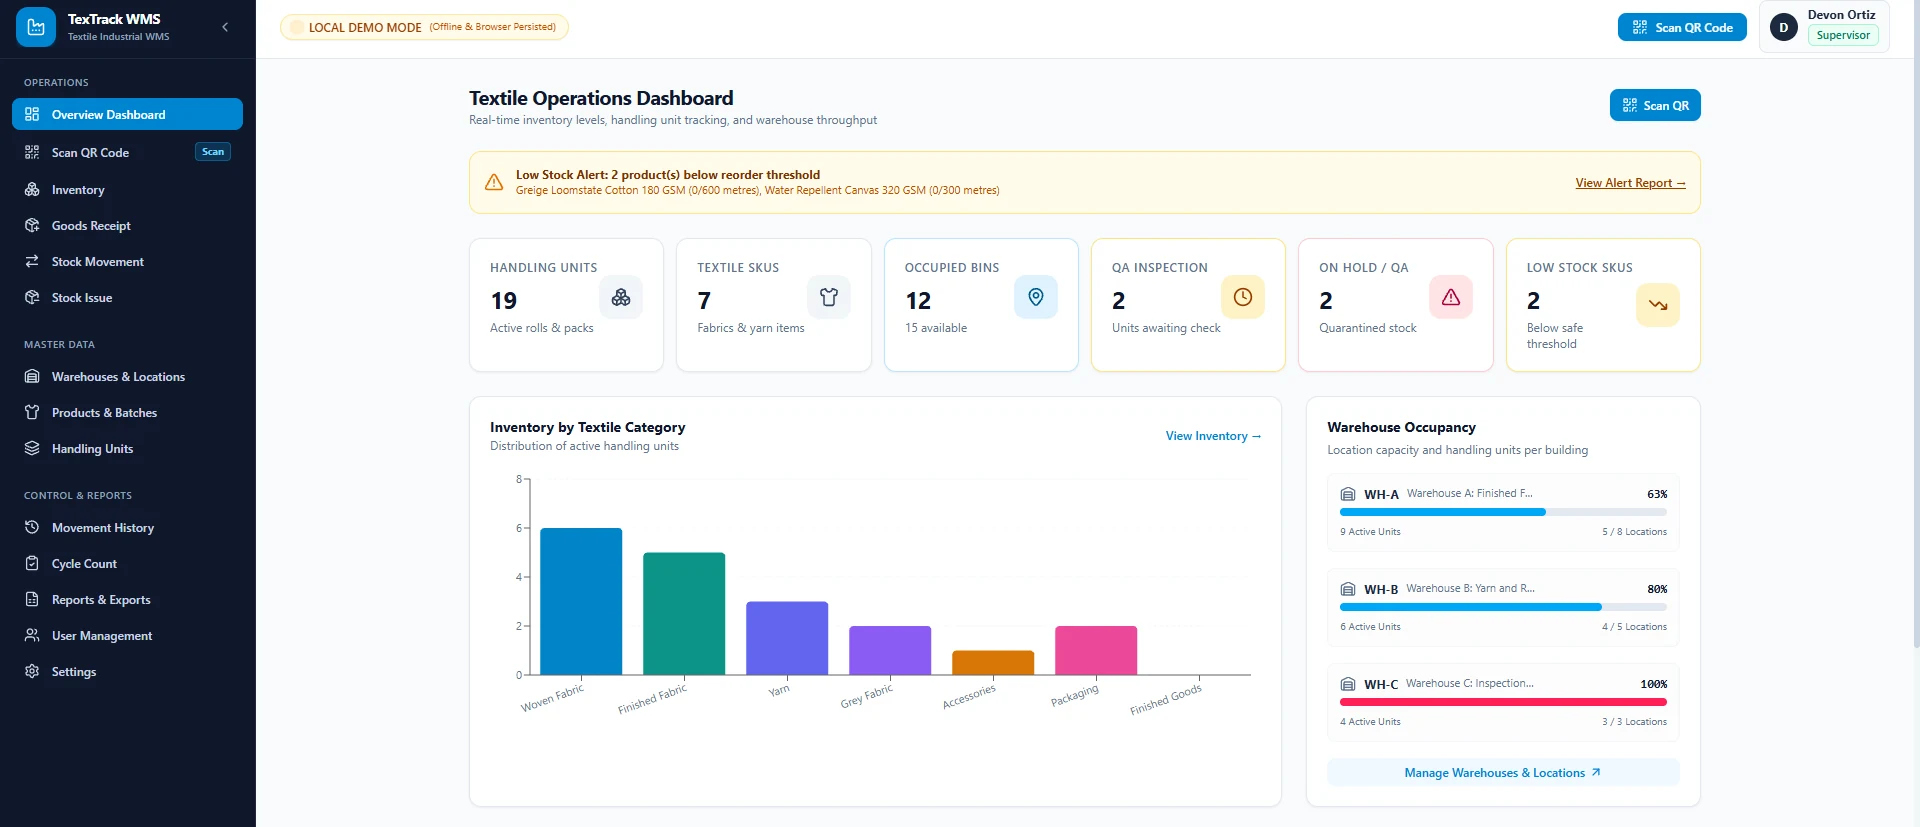
 Read the TexTrack case study
Power BI & Dashboards
Data Analytics & Business Reporting
Transform raw operational spreadsheets into clean, digestible visual summaries. We build repeatable reporting workflows that save hours of manual data collation and provide business owners with clear visibility over sales, inventory, and KPIs.
The problem
What this solves
Operations teams frequently drown in fragmented spreadsheets, losing hours each month manually copying numbers between files to create basic management reports, leaving leadership with delayed or inaccurate visibility over sales and inventory.
Good fit for: Business managers, production heads, and wholesale owners who want reliable visual reports and automated calculations from their existing operational data.
Included
What you get
- Interactive Power BI report dashboards with drill-down filters
- Structured Excel reporting models with automated formula calculations
- Core KPI tracking (monthly sales trends, SKU movement, order fulfillment)
- Inventory aging and reorder threshold summaries
- Repeatable, documented data collation workflows
Steps
How we deliver it
Data Audit & Source Mapping
Review existing Excel files, billing exports, or operational logs to identify key metrics.
Data Cleaning & Model Design
Normalize column schemas, remove duplicates, and build repeatable transformation models.
Dashboard & Report Construction
Build intuitive Power BI visual dashboards or structured Excel reporting templates.
Handover & Walkthrough
Train your team on refreshing the data and interpreting the core KPIs.
Related workRead the TexTrack case study
Projects like this
Read the TexTrack case study